Reading the Garmin G1000 in the Cessna 172
How the six flight instruments reappear as tapes and symbols on a Garmin G1000 Primary Flight Display in the Cessna 172, what the display computes for you, and how the instrument cross-check applies on a glass panel.
Independent educational resource; not approved flight training. Jonas Aviation is not an approved training organisation, and nothing on this page replaces formal instruction or approved aircraft manuals.
What you will learn
- Map each of the six primary flight instruments onto its representation on the G1000 Primary Flight Display.
- Explain what the PFD computes for the pilot, such as true airspeed, and what it simply displays from the same pitot-static measurements.
- Distinguish indicated information from the aircraft's actual behaviour, including the effect of wind on ground speed.
- Apply the attitude, altitude, airspeed and heading cross-check to a glass panel.
On this page
The same six flight instruments you met in the basic instruments lesson appear on a modern training aircraft, but on a Garmin G1000 they are drawn as moving tapes and symbols on one large screen instead of as six separate dials. This lesson maps each traditional instrument onto its place on the G1000 Primary Flight Display (PFD), explains what the display computes for you, and shows how the same cross-check from earlier lessons applies when everything lives on one screen.
From six instruments to two screens
A Cessna 172 equipped with the Garmin G1000 presents flight information on two large displays: the Primary Flight Display (PFD) in front of the pilot, and the Multi Function Display (MFD) in the centre of the panel. The PFD replaces the traditional six-pack for the pilot flying; the MFD handles navigation information, engine data and maps. Most training aircraft also keep a small set of standby instruments on the panel as an independent backup, and this lesson returns to that idea near the end.
The mapping between the old instruments and the PFD is direct, because the underlying measurements have not changed:
| Traditional instrument | Where it appears on the G1000 PFD | What has changed |
|---|---|---|
| Airspeed indicator | Vertical airspeed tape on the left edge of the attitude display | A moving tape instead of a round dial; the same pitot-static measurement |
| Attitude indicator | Large horizon display in the centre | Much larger; a roll pointer and slip/skid reference replace the traditional ball |
| Altimeter | Vertical altitude tape on the right edge of the attitude display | Digits move past a fixed pointer; a selected-altitude bug can be set |
| Heading indicator (directional gyro) | Horizontal situation indicator (HSI) compass card below the attitude display | The card rotates under a fixed aircraft symbol, combined with navigation pointers |
| Vertical speed indicator | A dedicated indication to the right of the altitude tape | A moving pointer on a fixed scale instead of a dial; same feet-per-minute meaning |
| Turn coordinator | Turn-rate indications above the HSI compass card, plus the slip/skid indicator on the attitude display | No separate instrument and no miniature aeroplane: standard-rate references live with the HSI, and coordination is shown by the slip/skid bar against the roll pointer, which also reads bank angle against the roll scale |
Reading the PFD at a glance
The layout described here follows the Garmin G1000 NXi Pilot's Guide for the Cessna NAV III (document 190-02177-02 Rev. A, which covers the Cessna 172R and 172S); other G1000 generations and individual installations may differ in small ways. The parts a beginner reads first are:
 12345
12345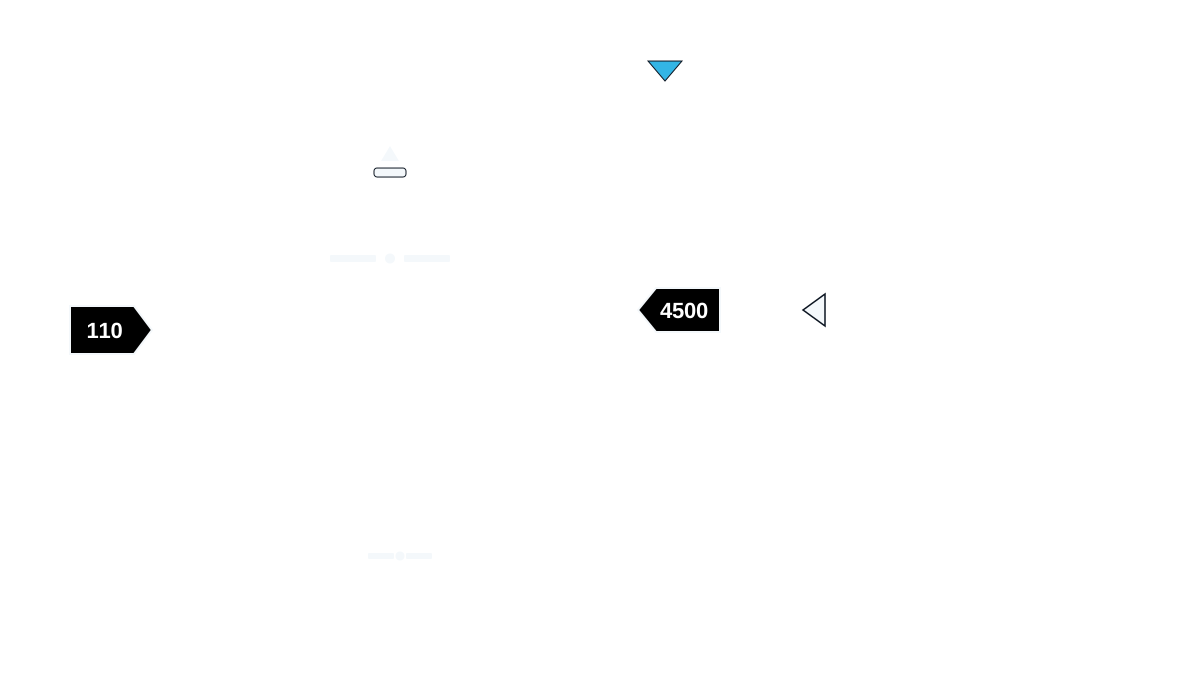
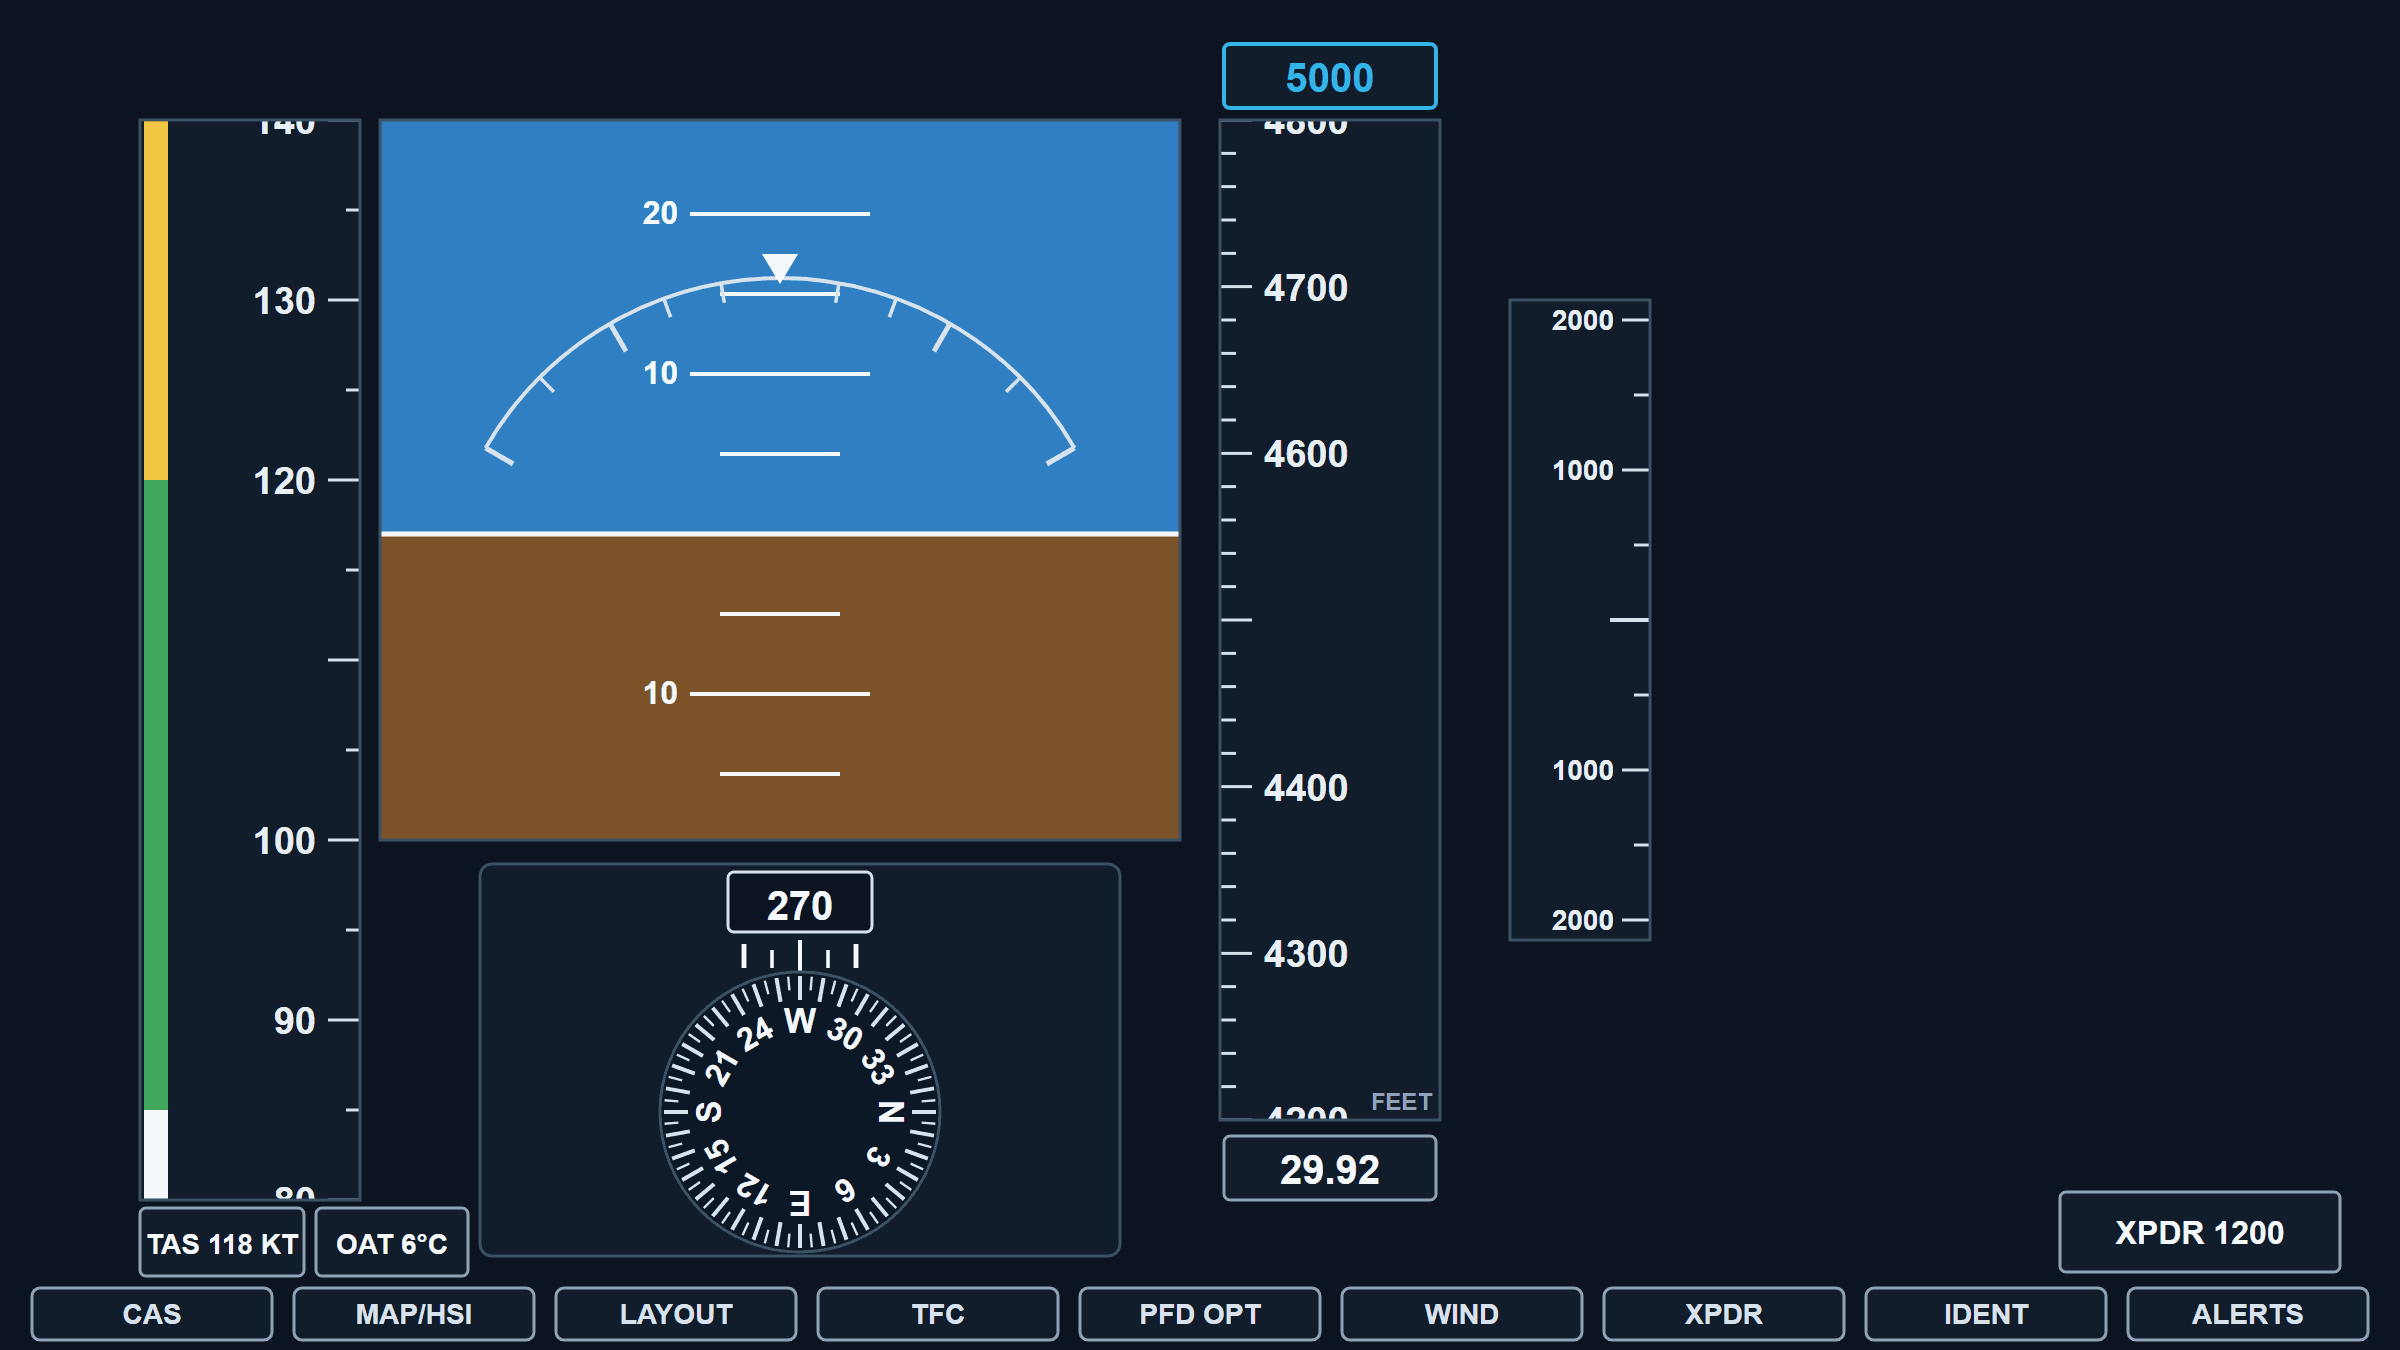
Garmin G1000 NXi primary flight display · simplified educational view
- Airspeed tape: the black pointer reads 110 kt indicated; major ticks every 10 kt, minor ticks every 5 kt
- Attitude: level horizon about 1° nose up; roll pointer and slip/skid bar centred, so the aircraft is neither slipping nor skidding
- Altitude tape: 4,500 ft through the fixed pointer, 5,000 ft selected (cyan bug at the tape edge), baro 29.92
- Vertical speed: fixed scale labelled 1000 and 2000 fpm, pointer at zero
- HSI: digital heading 270 above the card, with half-standard and standard-rate turn ticks directly above the compass card
- Data boxes: TAS 118 kt and OAT 6 °C lower left, transponder 1200 lower right, nine first-level softkey labels along the bottom edge
- Airspeed tape. Indicated airspeed in knots runs up and down a vertical tape on the left of the attitude display. Colour bands and marks on the tape reference the airspeed limitations defined for the specific aircraft, and a trend vector (a thin pointer) shows approximately where the speed will be about six seconds ahead if the current rate continues, as documented for the cited NXi configuration.
- Attitude indicator. The blue-over-brown horizon fills the centre of the display. Pitch is read against the printed degree scale, and bank angle against the roll pointer at the top. A small bar beneath the roll pointer shows slip or skid: keep it centred and the aircraft is neither slipping nor skidding, exactly the job the ball did on the traditional panel.
- Altitude tape. Indicated altitude in feet moves past a fixed pointer on the right of the attitude display. A barometric pressure setting is displayed next to it and is set with a knob, the same "altimeter setting" job as on a round-dial altimeter.
- Vertical speed indicator. To the right of the altitude tape, a moving pointer on a fixed scale shows climb or descent rate in feet per minute, with the same lag a traditional VSI has: it reports what is happening now, a little behind the moment.
- HSI. Below the attitude display, a compass card shows magnetic heading under a fixed aircraft symbol. Turn-rate indications with half-standard and standard-rate references sit directly above the card, separate from the slip/skid indication, and navigation pointers can be overlaid on the same symbol; the first skill is simply reading the heading.
- Supporting data. The display also carries outside air temperature, selected altitude, transponder information and softkey labels along the bottom edge. None of these replace the core six readings; they add context.
Indicated information and actual behaviour
A display can only show what its sensors measure, so the difference between the indication and what the aircraft is actually doing remains the pilot's job to understand:
- Indicated airspeed is not speed over the ground. The airspeed tape reads the pressure of the air flowing past the aircraft. Wind moves the whole air mass, so two identical indicated speeds can be very different ground speeds depending on whether the air is helping or resisting the aircraft. In still air at typical training altitudes the two numbers stay close; with wind they part company, and neither instrument is broken.
- True airspeed is computed, not measured. The PFD combines the pressure measurement with the outside air temperature to display true airspeed. Because air grows thinner with altitude, true airspeed at a given indicated airspeed is higher the higher you fly, which is why a climb at a fixed indicated speed shows a gradually rising true airspeed number.
- Altitude is indicated altitude. The altitude tape shows height above the pressure value dialed into the barometric setting, exactly like a traditional altimeter. That reading is called indicated altitude, and it depends on the setting: change the setting and the reading changes, even though the aircraft has not moved. Dial in the standard 29.92 inHg and the tape shows pressure altitude instead, the height above that standard datum.
- Trends are predictions. The small trend pointers on the airspeed and altitude displays extrapolate the current rate to approximately the value expected about six seconds ahead, the horizon documented for the cited G1000 NXi configuration. They assume nothing else changes; a pilot who pulls the power back will watch the prediction unwind again.
The cross-check on glass
The cross-check from the basic instruments lesson survives unchanged; only the layout is new:
- Attitude first. Pitch and power produce performance, so the attitude display is where precise control inputs are made and confirmed.
- Altitude confirms. The altitude tape and vertical speed indicator tell you whether that attitude is producing the climb, descent or level flight you planned.
- Airspeed warns. Speed is the earliest sign that pitch or power has drifted away from the plan, so it stays in the scan even when altitude is stable.
- Heading tracks. The HSI shows where the attitude is taking you; drift and lazy turns show up here.
 12345
12345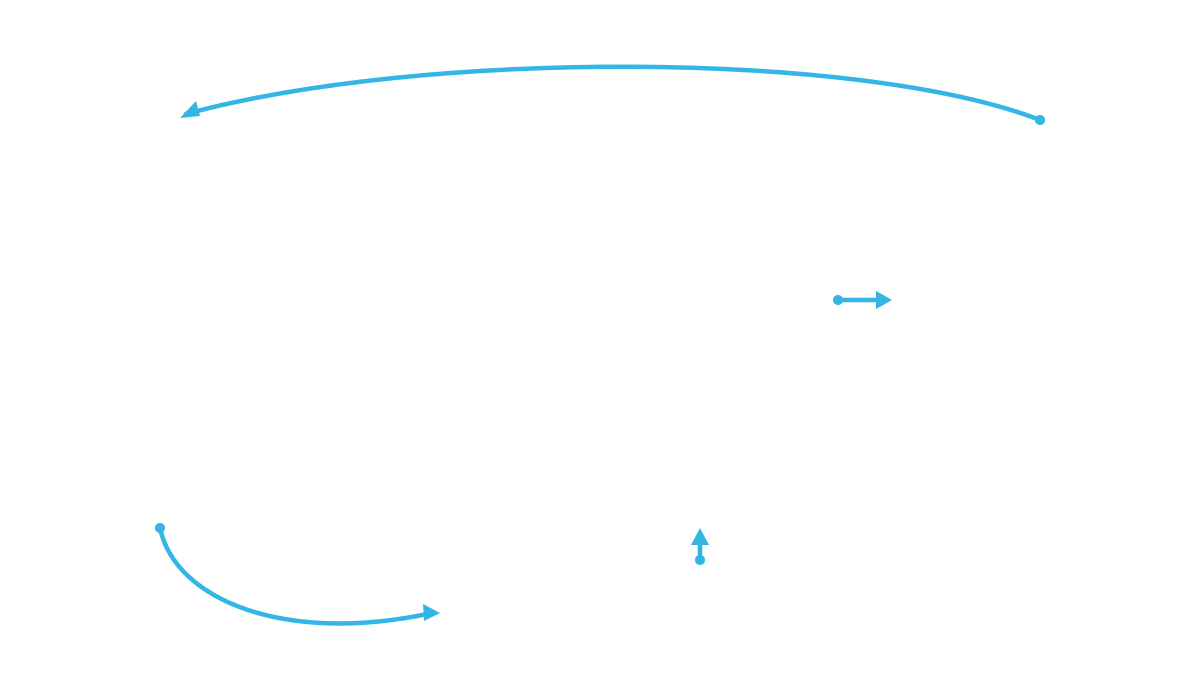
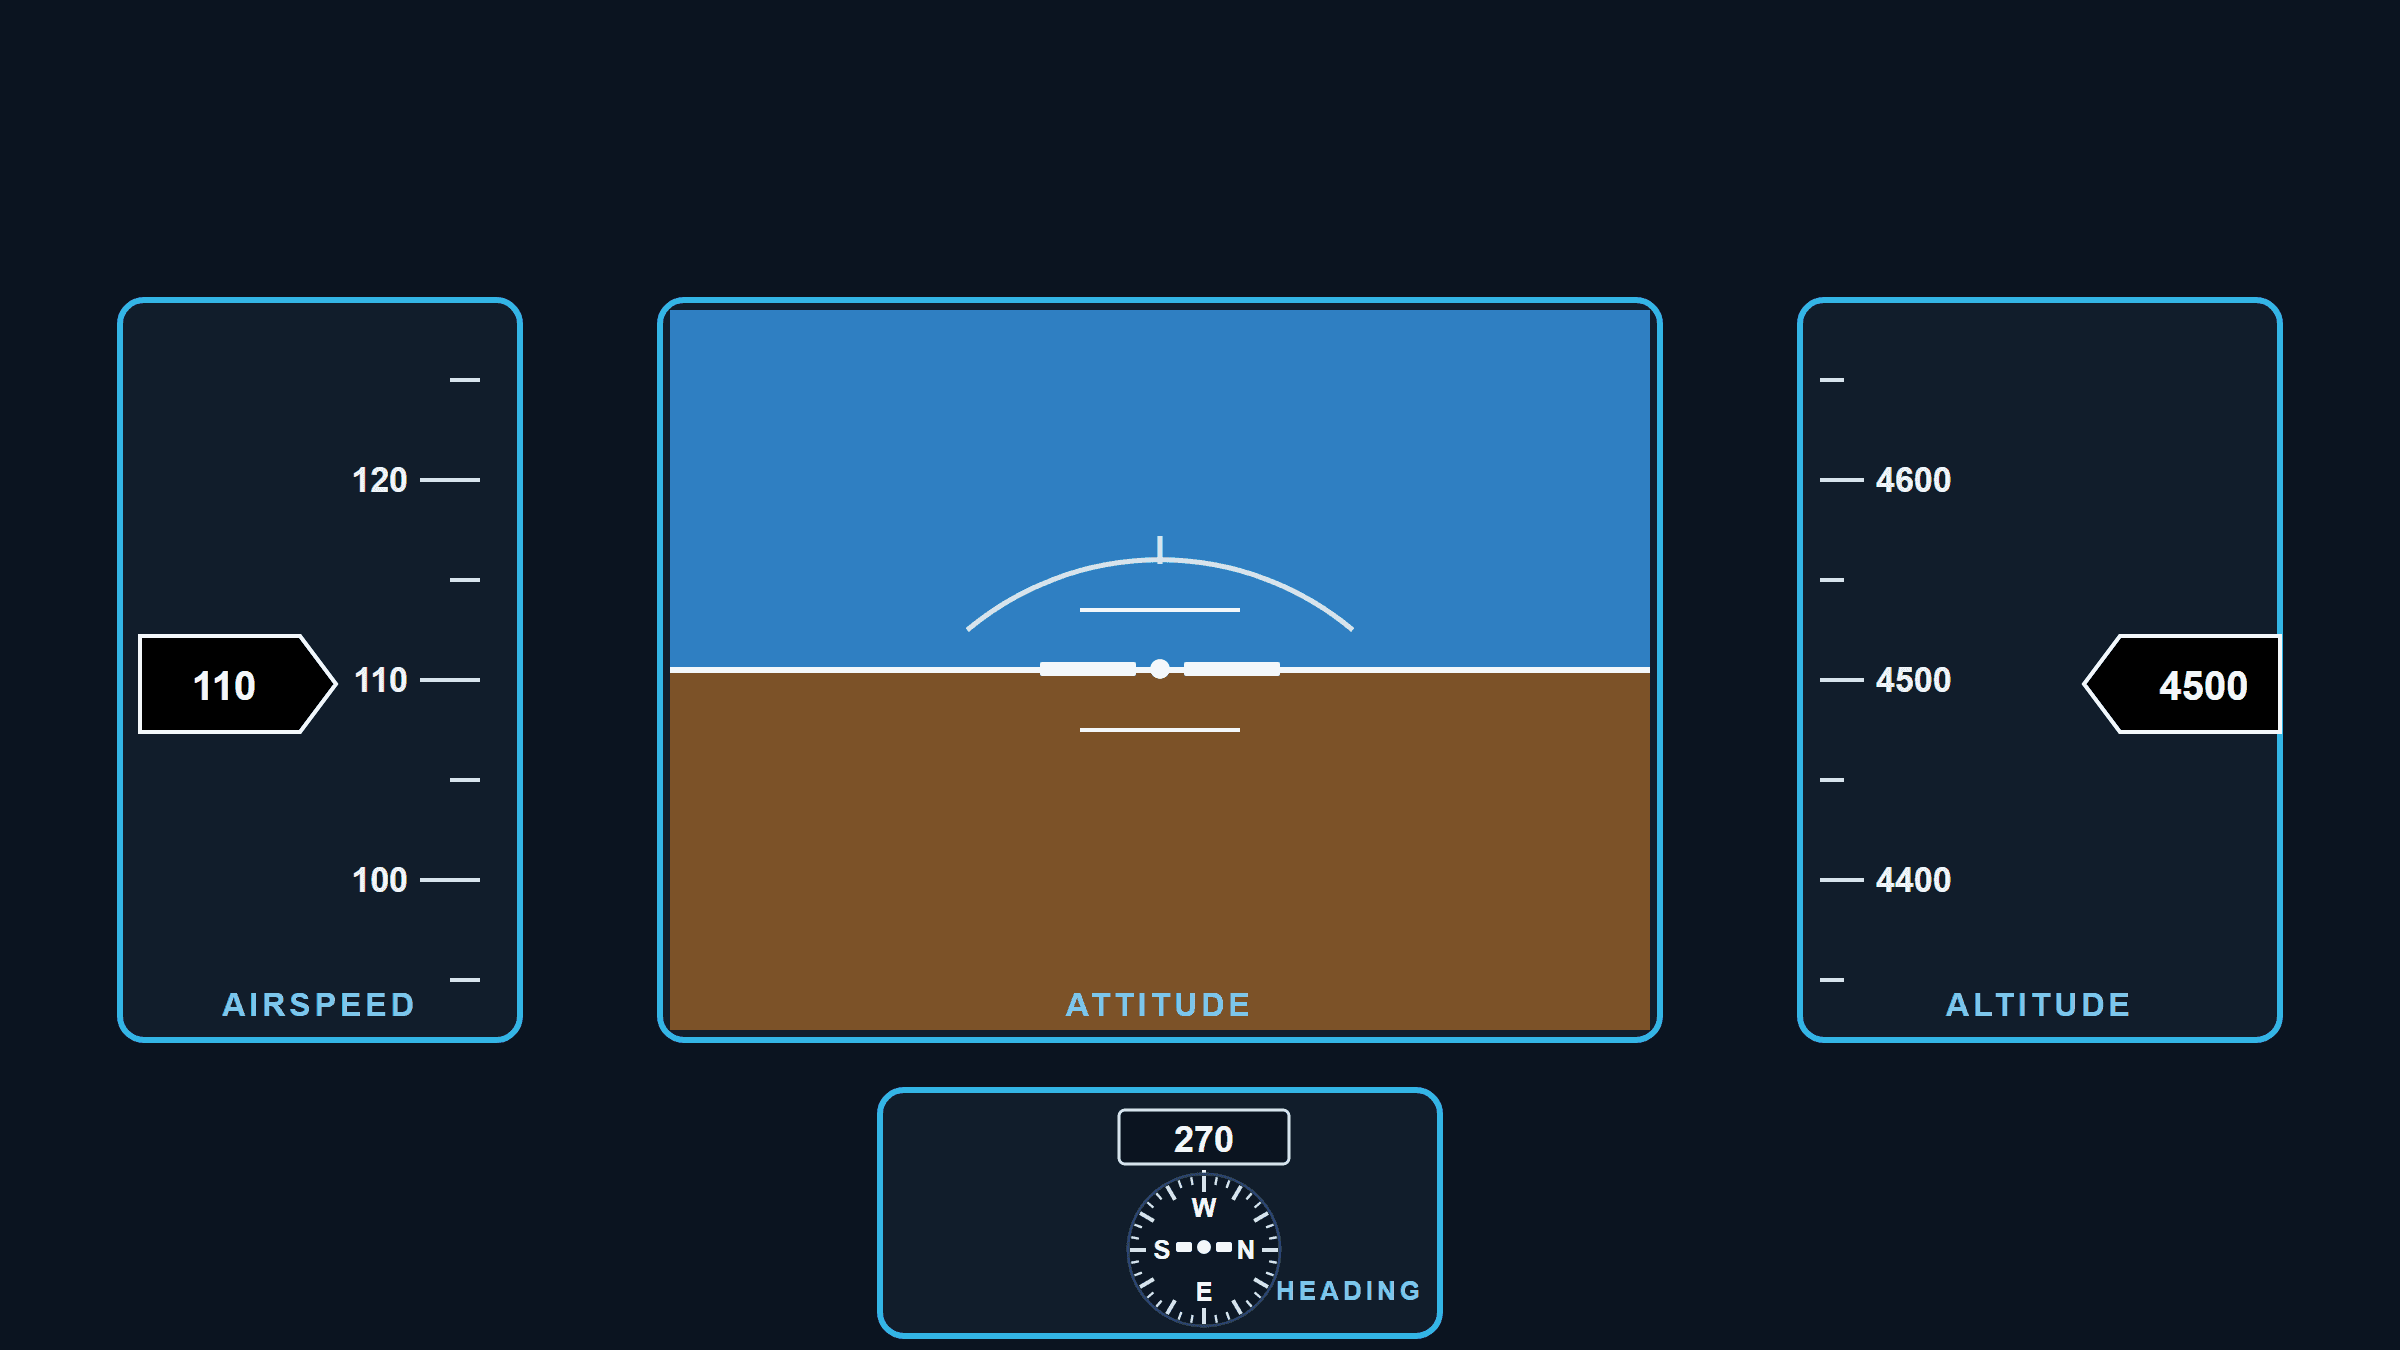
Beginner instrument cross-check · simplified primary flight display
- Attitude first: pitch and power produce performance, so control inputs start and finish here
- Altitude confirms: the tape and vertical speed show whether the attitude is producing the planned result
- Airspeed warns: speed is the earliest sign that pitch or power has drifted from the plan
- Heading tracks: the HSI shows where the attitude is taking you
- Back to attitude: close the loop and repeat; a beginner habit scan, not an exhaustive instrument procedure
On a traditional panel these readings sit in two tight rows, and on a PFD they sit within one glance of each other. The scan itself does not change: attitude, altitude, airspeed, heading, repeat.
Worked example: reading a climb
You are in straight level flight and pitch up gently to begin a climb.
- The attitude indicator shows the new pitch attitude first, within a second or two of the control input.
- The vertical speed indication follows after a short lag, settling around a climb rate of, for example, 700 feet per minute.
- The altitude tape starts unwinding upward at a matching rate: 700 feet per minute is close to 12 feet per second, so the last two digits of the altitude tape change at roughly that rate.
- If the airspeed tape decays steadily while pitch stays fixed, the aircraft is trading speed for height, and the pilot can choose whether to add power or accept the lower speed. If instead the vertical speed indication begins falling while the attitude is unchanged, something else changed, and the instruments disagreeing is itself information.
The same reading order applies in reverse for a descent: attitude, rate, altitude, speed.
A realistic simulator session
Everything in this lesson can be practised with a paused simulator session, and this is where the simulator companion exercise on this site continues the work. In a steady cruise situation, read aloud the five values from your PFD (airspeed, attitude, altitude, heading, vertical speed), then make a small pitch change and watch the reading order described above repeat. Compare the heading with the view outside: in wind, the direction the nose points and the direction the aircraft travels across the ground are not the same, and that is the lesson on indicated versus actual behaviour made visible.
Common misconceptions
"The glass display removes the instrument errors I learned about." It does not. The same pitot tube can still block, the same static ports can still freeze, and the same pressure-altitude rules still apply. Aircraft fitted with glass panels keep standby instruments for exactly this reason: an independent backup for the information that matters most.
"Indicated airspeed is what the aircraft is actually doing." Indicated airspeed is what the wing and the controls feel, which is what matters for flying the aircraft. What the aircraft is doing over the ground is a different quantity, affected by the air it is flying through. The two answer different questions, and both are useful.
"The scan is easier on a big screen, so I can look outside more." The scan gets faster, not optional. Attitude control is a continuous task in every phase of flight, and the enlarged attitude display rewards a brief, steady glance rather than a long stare. The habits built on the six-pack are the habits that keep the PFD useful.
Recap
- The G1000 PFD presents the six traditional instruments as tapes, scales and symbols: airspeed tape, attitude display, altitude tape, vertical speed indicator, the HSI with its turn-rate references, and the roll and coordination references.
- The measurements are unchanged from the pitot-static and gyroscopic instruments lesson; only the presentation is new, and standby instruments remain as independent backups.
- Indicated information and actual behaviour differ: wind separates indicated airspeed from ground speed, true airspeed is computed from pressure and temperature, and altitude reads as indicated altitude from whatever barometric setting is dialed in.
- The cross-check is the same on glass: attitude first, altitude confirms, airspeed warns, heading tracks.
- Simulator representations of any of this vary by product and installation, so confirm what your own simulator shows instead of assuming.
Sources and further reading
- FAA: Pilot's Handbook of Aeronautical Knowledge (FAA-H-8083-25C), Chapter 8: Flight Instruments (opens in a new tab)Accessed 13 October 2026
- Garmin: G1000 NXi Pilot's Guide for the Cessna NAV III (document 190-02177-02 Rev. A, System Software Version 2501.09 or later; covers the Cessna 172R and 172S) (opens in a new tab)Accessed 13 October 2026
Last editorial review: 14 October 2026. Authored 13 October 2026.
Knowledge check: Reading the Garmin G1000 in the Cessna 172
Answer 6 questions to check what you learned. These are original Jonas Aviation practice questions: not official examination questions, and they grant no credit toward any certificate.
Finished this lesson?
Mark it complete to track your progress through the course on this device.
That is every published lesson in this course for now. Back to the course to see what is coming next. Further lessons are in editorial review.